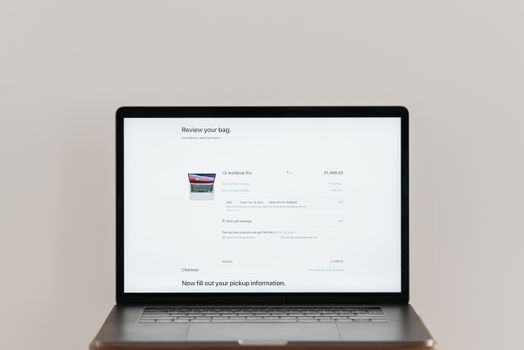
Shopping cart abandonment remains one of the most persistent challenges for e-commerce businesses. According to the Baymard Institute, the average documented online shopping cart abandonment rate is a staggering 70.19% as of 2024. This means that for every 10 potential customers, seven leave without completing their purchase. While conversion-focused strategies such as upselling or remarketing are often discussed, fewer retailers focus on the root cause: the shopping cart experience itself. In this article, we’ll break down how to analyze and optimize your online shopping cart to directly reduce abandonment rates, using data-driven techniques and actionable insights.
Understanding Why Shoppers Abandon Their Carts
Before diving into optimization, it’s crucial to understand the multifaceted reasons behind cart abandonment. While some factors are beyond a retailer’s control (such as window shopping or price comparisons), many are directly linked to the shopping cart’s structure and functionality.
According to Statista, the top reasons for cart abandonment in 2023 were:
.png) - Extra costs too high (48%)
- Required account creation (24%)
- Too long/complicated checkout process (18%)
- Unclear total order cost (16%)
- Website errors/crashes (13%)
- Unsatisfactory return policy (11%)
- Lack of trust in payment security (8%)
- Extra costs too high (48%)
- Required account creation (24%)
- Too long/complicated checkout process (18%)
- Unclear total order cost (16%)
- Website errors/crashes (13%)
- Unsatisfactory return policy (11%)
- Lack of trust in payment security (8%)
This data underscores the need for a frictionless, transparent, and reliable cart and checkout experience. By analyzing these key pain points within your own store, you can target optimizations with the greatest impact.
Using Analytics to Pinpoint Cart Abandonment Issues
Data is your most powerful ally in understanding cart abandonment. Modern analytics tools offer granular insights into user behavior—enabling you to identify exactly where shoppers drop off in the cart and checkout process.
Key analytics to monitor include:
- Cart abandonment rate: The percentage of carts created that do not result in a purchase. - Funnel analysis: Tracking the steps from cart initiation to completed order, highlighting major drop-off points. - Time on cart page: Are users hesitating before proceeding? - Click tracking and heatmaps: Where do users click, hover, or get stuck? - Device and browser breakdown: Are abandonment rates higher on mobile or specific browsers?For example, Google Analytics Enhanced Ecommerce provides step-by-step breakdowns of your funnel, while tools like Hotjar or Crazy Egg visualize user interaction through heatmaps and session recordings. By combining quantitative data (drop-off rates) with qualitative insights (user recordings), you can create a prioritized list of issues to address.
Optimizing the Cart Layout and User Experience
Once you’ve identified key stumbling blocks, focus on optimizing the shopping cart’s design, layout, and user experience. Small tweaks here can yield substantial improvements in conversion rates.
Key optimization strategies include:
1. $1: A cluttered cart page confuses and distracts shoppers. Present only essential information: product image, name, price, quantity, and subtotal. Allow easy editing of item quantities or removal of products. 2. $1: Show a visual progress bar (e.g., Cart → Shipping → Payment → Review) to help users understand how many steps remain. According to a study by Baymard, progress indicators can reduce abandonment by up to 12%. 3. $1: Ensure your “Proceed to Checkout” or “Complete Purchase” buttons are highly visible and use action-oriented language. 4. $1: Display SSL certificates, trust badges, and payment security icons near the checkout button. A Baymard survey found that 18% of US shoppers have abandoned carts due to security concerns. 5. $1: Remove unrelated navigation or promotional banners that might lead users away from completing their purchase.Transparent Pricing and Minimizing Surprises
Unexpected costs remain the number one reason for cart abandonment. Shoppers are far more likely to convert if pricing is transparent from the outset.
Here’s how to address this crucial issue:
- $1: Include shipping, taxes, and fees as soon as possible. Many e-commerce sites now show an estimated total in the cart based on the shopper’s location. - $1: Allow users to enter their ZIP code or country in the cart to see exact shipping costs before checkout. - $1: If using coupons or promotions, show how they affect the total price in real time.A 2023 Walker Sands report found that 79% of consumers are more likely to buy when offered free shipping. Even if free shipping isn’t possible, being upfront about costs builds trust and reduces last-minute abandonment.
Streamlining the Checkout Process
Long, complicated checkouts are conversion killers. Simplifying and streamlining this process can dramatically reduce drop-offs.
Best practices include:
- $1: Forcing account creation deters nearly a quarter of shoppers. Always offer a guest checkout, and provide the option to sign up after purchase. - $1: Use tools that auto-complete address fields and validate input to minimize manual entry. - $1: Only ask for essential information—studies show that reducing checkout form fields from 15 to 7 can increase conversions by 20%. - $1: Support major credit cards, digital wallets like PayPal, Apple Pay, and emerging methods like Buy Now, Pay Later.The table below compares the impact of key checkout optimizations on abandonment rates:
| Optimization | Abandonment Rate Reduction | Example/Statistic |
|---|---|---|
| Guest Checkout Enabled | Up to 23% reduction | Baymard Institute, 2023 |
| Form Field Reduction | 10-20% increase in conversions | Invesp, 2022 |
| Multiple Payment Methods | Up to 30% reduction | Statista, 2023 |
| Progress Indicators | Up to 12% reduction | Baymard Institute, 2023 |
Personalization and Dynamic Cart Features
Today’s shoppers expect a tailored experience. Personalizing the shopping cart based on user behavior and preferences can further reduce abandonment.
Consider these advanced optimizations:
- $1: Allow users to save their cart, or automatically store cart contents for returning visitors. - $1: Use pop-ups or banners that trigger when a user is about to leave the cart page, offering a small discount or free shipping. - $1: Alert users when stock is low or items are selling fast, creating a sense of urgency. - $1: Ensure that users can access their cart contents across devices (mobile, tablet, desktop).For example, Amazon’s cart automatically saves items for later and syncs across logged-in devices, significantly reducing friction for returning customers. According to Monetate, personalized experiences can increase conversion rates by up to 20%.
Measuring Success and Iterating for Continuous Improvement
Optimization is an ongoing process. Once you’ve implemented changes, it’s essential to measure their impact and continue refining based on user feedback and analytics.
Steps to ensure ongoing improvement:
- $1: Test different cart layouts, checkout flows, and CTAs to determine what works best for your audience. - $1: Track abandonment rates, conversion rates, average order value, and time to complete checkout. - $1: Use post-purchase surveys or on-site feedback tools to learn directly from shoppers about pain points. - $1: E-commerce best practices evolve rapidly. Regularly review industry benchmarks and competitor strategies.For example, after reducing checkout form fields, a leading apparel retailer saw a 15% decrease in abandonment and a 10% increase in completed orders within three months. Continuous data-driven adjustments ensure you’re not leaving potential revenue on the table.
Final Thoughts on Analyzing and Optimizing Your Shopping Cart
Reducing shopping cart abandonment isn’t about guesswork—it’s about data-driven analysis and targeted optimization. By understanding why shoppers leave, using analytics to pinpoint friction points, and implementing best practices in cart design, transparency, and checkout flow, you can directly impact your bottom line. Remember, even small improvements can yield significant revenue gains in high-traffic e-commerce environments. Keep testing, measuring, and refining for an ever-better shopping experience.